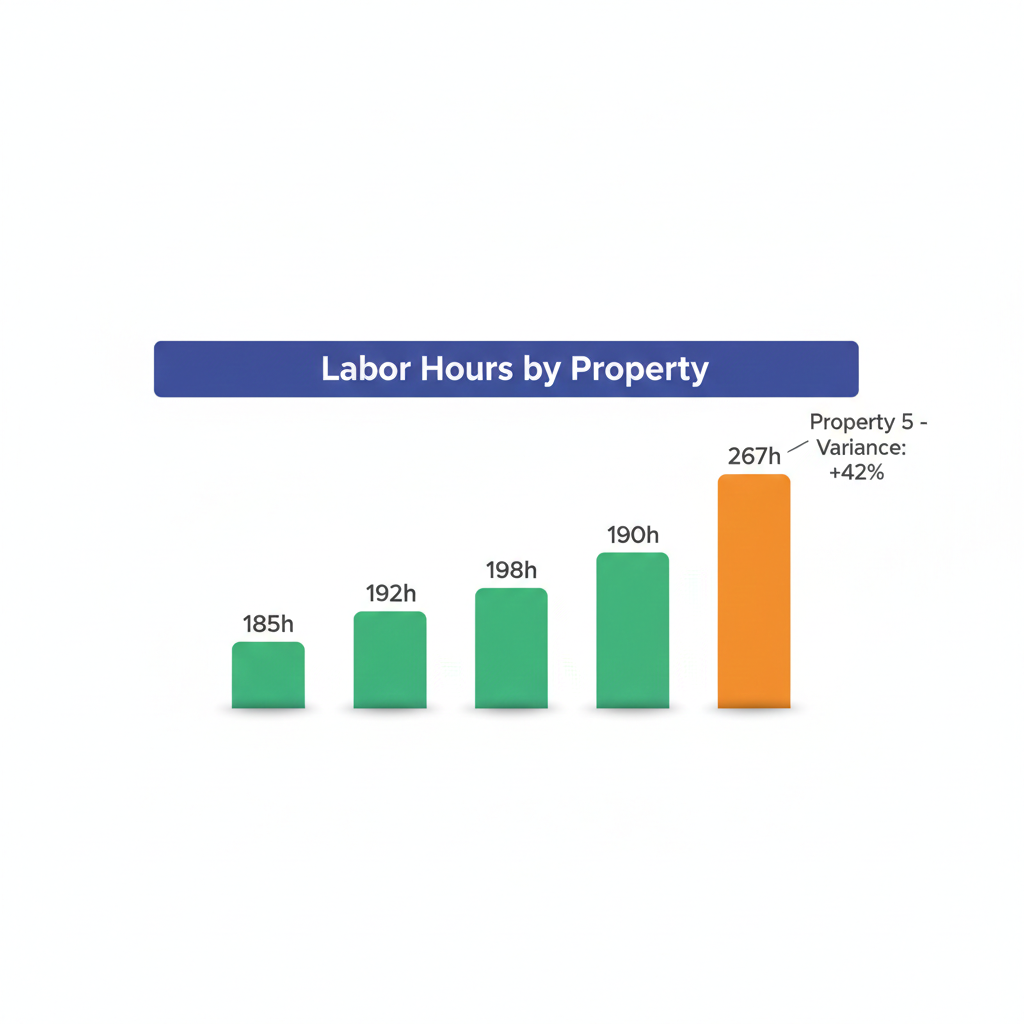

You operate fifteen properties. Each general manager swears they run a tight ship. Yet when you pull the numbers, one property spends 2.1 hours per occupied room (HPOR—Hours Per Occupied Room) on housekeeping while another spends 0.9 hours. Both claim their approach is correct.
Which property is underperforming? And which one is cutting corners?
Without cross-property labor data, you cannot answer that question. You can only accept each property’s narrative at face value—and that costs you money.
Pro Tip from the Floor: “When I showed my GMs the labor variance data side by side, three of them immediately asked, ‘What is Property 7 doing differently?’ That single conversation saved us more than $180,000 in annual labor costs.” — Vice President of Operations, 23-property portfolio
Industry data from 2025 reveals that hours per occupied room varies dramatically by hotel type—from 1.30 for extended-stay properties to 4.48 for resorts. Within those categories, the variance between top and bottom performers often exceeds 30 percent. This variance represents either waste or underservice. Your job is to determine which.
This article provides a comprehensive framework for analyzing labor variance across properties, identifying outliers, and implementing data-driven standardization that protects both margins and service quality.
Understanding Labor Variance in Multi-Property Operations
What Labor Variance Actually Measures
Labor variance is the difference between expected and actual labor deployment across comparable properties. It answers a fundamental question: Are we staffing consistently, and if not, why?
| Variance Type | Definition | Example |
|---|---|---|
| Absolute Variance | Difference in raw hours between properties | Property A: 1.2 HPOR vs. Property B: 1.6 HPOR |
| Relative Variance | Percentage deviation from portfolio mean | Property C: +18% above average |
| Trend Variance | Change in labor metrics over time | Property D: HPOR increased 12% since Q1 |
| Departmental Variance | Differences within specific functions | Housekeeping variance: 0.4 hours; Front desk: 0.1 hours |
Pro Tip from the Floor: “I used to think variance was just about different property sizes. Then I normalized for occupancy and room count—and the variance actually increased. That told me the problem was operational, not structural.” — Regional Director, 11 select-service properties
Why Variance Matters for Portfolio Profitability
Labor costs typically represent 30 to 45 percent of total operating expenses in hotels. Even small variance across a portfolio compounds into significant financial impact.
Portfolio-Level Impact Analysis:
| Scenario | Calculation | Annual Impact |
|---|---|---|
| 20 properties, average 150 rooms each | 20 × 150 = 3,000 rooms | — |
| Average occupancy 72% | 3,000 × 0.72 × 365 = 788,400 occupied room nights | — |
| 10% labor variance = 0.15 extra HPOR | 788,400 × 0.15 = 118,260 extra hours | — |
| Average hourly cost $18 (including benefits) | 118,260 × $18 = $2,128,680 | $2.1 million annual variance cost |
A 10 percent labor variance across a mid-sized portfolio represents more than $2 million in potential savings—or losses, depending on how you manage it.
The 2025-2026 Labor Efficiency Landscape
Industry Benchmarks for Context
Before analyzing your own variance, you need context. Industry data from January through September 2025 shows:
Hours Per Occupied Room by Hotel Type:
| Hotel Category | Average HPOR | Range (Low–High) | Notes |
|---|---|---|---|
| Extended Stay | 1.30 | 1.25–1.45 | Most efficient due to reduced daily service |
| Select Service | 1.44 | 1.20–1.75 | Variance depends on amenity level |
| Full Service | 2.57 | 2.10–3.20 | F&B operations drive higher labor |
| Resorts | 4.48 | 3.66–5.44 | High seasonal variance, extensive amenities |
Departmental HPOR Benchmarks (Select Service):
| Department | Industry Average HPOR | Top Quartile | Bottom Quartile |
|---|---|---|---|
| Guest Services | 0.39 | 0.32 | 0.48 |
| Housekeeping | 0.74 | 0.62 | 0.88 |
| Management | 0.20 | 0.15 | 0.28 |
| Maintenance | 0.11 | 0.08 | 0.16 |
Pro Tip from the Floor: “The first time I saw that our housekeeping HPOR was 0.91 against an industry average of 0.74, I did not believe it. Then I watched our room attendants for a week—they were walking twice as far as they needed to because of our room assignment system.” — Executive Housekeeper, full-service property
For more context on staffing analysis, see our guide on building a hotel audit culture with staff ownership.
Building a Labor Variance Analysis Framework
Step 1: Normalize Your Data
Raw labor hours are meaningless without normalization. Two properties with identical hours may have vastly different efficiency if one runs at 85 percent occupancy while the other runs at 65 percent.
Essential Normalization Factors:
| Factor | Why It Matters | How to Apply |
|---|---|---|
| Occupancy | Higher occupancy should mean higher hours | Calculate HPOR instead of total hours |
| Room count | Larger properties may have scale efficiencies | Compare HPOR, not absolute hours |
| Service level | Full-service vs. select-service | Group by hotel type before comparing |
| Stayover ratio | More stayovers = more cleaning hours | Adjust for departure-to-stayover mix |
| Physical layout | Vertical vs. horizontal, distance between rooms | Apply layout adjustment factor |
Normalization Formula:
Normalized HPOR = Total Department Hours / Occupied Room Nights

Adjusted HPOR = Normalized HPOR × Layout Factor × Service Level Factor
Step 2: Establish Variance Thresholds
Not all variance requires action. You need thresholds that distinguish acceptable variation from performance issues.
Recommended Variance Thresholds:
| Variance Level | Deviation from Mean | Recommended Action |
|---|---|---|
| Green Zone | ±5% | No action required; normal variation |
| Yellow Zone | ±6–15% | Investigation recommended; review processes |
| Red Zone | ±16–25% | Immediate attention; site visit or detailed audit |
| Critical | >25% | Emergency intervention; possible leadership issue |
Pro Tip from the Floor: “We wasted months investigating properties that were only 8 percent off the mean. Now we use a 15 percent threshold for action—anything below that is just noise.” — Director of Operations Excellence, 45-property portfolio
Step 3: Segment Analysis by Department
Portfolio-level HPOR masks departmental issues. A property might be efficient in housekeeping but overstaffed at the front desk. Segmented analysis reveals these hidden problems.
Departmental Variance Dashboard Template:
| Property | Housekeeping HPOR | vs. Mean | Front Desk HPOR | vs. Mean | Maintenance HPOR | vs. Mean |
|---|---|---|---|---|---|---|
| Property A | 0.68 | -8% | 0.42 | +5% | 0.09 | -18% |
| Property B | 0.82 | +11% | 0.38 | -5% | 0.12 | +9% |
| Property C | 0.91 | +23% | 0.51 | +28% | 0.14 | +27% |
In this example, Property C shows consistent overdeployment across all departments—suggesting a systemic management issue rather than a departmental problem.
For more on portfolio-level metrics, see our guide on portfolio audit dashboard metrics that matter.
Identifying Outlier Properties
The Outlier Identification Matrix
Use a structured matrix to identify which properties require intervention and what type.
Outlier Classification System:
| Outlier Type | Characteristics | Common Causes | Intervention |
|---|---|---|---|
| High Labor, High Scores | Above-average HPOR, above-average quality | Possible overservice or inefficient processes | Process optimization |
| High Labor, Low Scores | Above-average HPOR, below-average quality | Management or training issues | Leadership review |
| Low Labor, High Scores | Below-average HPOR, above-average quality | Best practice candidate | Study and replicate |
| Low Labor, Low Scores | Below-average HPOR, below-average quality | Understaffing or quality shortcuts | Staffing increase |
Pro Tip from the Floor: “I had a property that was our lowest HPOR performer. Everyone assumed they were the model to follow. Then we cross-referenced with guest satisfaction—they were also our lowest NPS score. They were not efficient; they were just cutting corners.” — VP of Operations, branded management company
Statistical Outlier Detection
Beyond simple variance analysis, statistical methods help identify true outliers versus normal distribution.
Z-Score Method:
The Z-score measures how many standard deviations a property’s performance is from the portfolio mean. A Z-score above 2 or below -2 typically indicates a statistically significant outlier.
Z-Score = (Property HPOR - Portfolio Mean HPOR) / Standard Deviation

Example:
Portfolio Mean HPOR: 1.42
Standard Deviation: 0.18
Property X HPOR: 1.85

Z-Score = (1.85 - 1.42) / 0.18 = 2.39

Interpretation: Property X is 2.39 standard deviations above the mean—a statistical outlier requiring investigation.
Root Cause Investigation Protocol
Once you identify outliers, structured investigation prevents wasted effort.
Root Cause Checklist:
| Category | Investigation Questions | Data Sources |
|---|---|---|
| Staffing Model | Is the property following brand staffing guidelines? | Scheduling system, manager interviews |
| Scheduling Efficiency | Are shifts aligned with demand patterns? | Time clock data, occupancy forecasts |
| Training Issues | Do employees know efficient procedures? | Audit scores, training records |
| Physical Constraints | Does the building layout create inefficiencies? | Property walkthrough, time-motion study |
| Management Practices | Is leadership enforcing standards? | Manager tenure, turnover rates |
| Local Market Factors | Are there union rules or local regulations? | Employment contracts, legal review |
For a broader framework on property issues, see our related guide on why audit scores vary across properties.
Data-Driven Staffing Optimization Strategies
Strategy 1: Establish Portfolio Staffing Standards
Create standardized staffing models that allow controlled variation while preventing extreme outliers.
Staffing Standard Template (Select Service Example):
| Department | Base HPOR | Occupancy Adjustment | Max Allowable HPOR |
|---|---|---|---|
| Housekeeping | 0.70 | +0.05 per 10% over 70% occupancy | 0.85 |
| Front Desk | 0.35 | +0.03 per 10% over 70% occupancy | 0.45 |
| Maintenance | 0.10 | None (fixed model) | 0.12 |
| Management | 0.18 | None (fixed model) | 0.20 |
Pro Tip from the Floor: “Giving GMs a target without a ceiling just meant they hit the target and ignored everything above it. When I added a maximum HPOR, variance dropped 22 percent in one quarter.” — Regional VP, 18-property group
Strategy 2: Implement Cross-Property Scheduling Templates
Standardized scheduling templates ensure comparable properties deploy labor similarly, reducing variance from idiosyncratic local practices.
Scheduling Template Components:
| Element | Standard | Allowable Variation |
|---|---|---|
| Shift start times | Aligned with check-in/check-out peaks | ±30 minutes for local needs |
| Minimum shift length | 4 hours (prevents split-shift inefficiency) | None |
| Stayover-to-departure ratio | 8:1 for room attendants | ±10% based on layout |
| Supervisor-to-staff ratio | 1:12 for housekeeping | ±2 based on experience levels |
| Overtime threshold | 5% of total hours | +2% for peak season |
Strategy 3: Deploy Real-Time Labor Dashboards
Static monthly reports cannot catch variance as it develops. Real-time dashboards enable intervention before variance becomes entrenched.
Dashboard Requirements:
| Feature | Purpose | Update Frequency |
|---|---|---|
| Daily HPOR by property | Catch variance immediately | Daily (automated) |
| Rolling 7-day trend | Identify emerging patterns | Daily |
| Department breakdown | Locate variance source | Daily |
| Occupancy overlay | Contextualize labor against demand | Daily |
| Alert thresholds | Notify when variance exceeds limits | Real-time |
Strategy 4: Institutionalize Best Practice Sharing
Your lowest-variance, highest-performing properties hold the knowledge your outliers need. Formalize the transfer of that knowledge.
Best Practice Transfer Program:
| Activity | Frequency | Participants | Output |
|---|---|---|---|
| Quarterly operations calls | Every 90 days | All GMs and department heads | Video recording + summary document |
| Property exchange visits | Twice annually | GMs from outlier properties visit top performers | Written improvement plan |
| Standard operating procedure (SOP) library | Ongoing | Contributed by top performers | Centralized SOP repository |
| Efficiency awards | Annual | All properties | Recognition + bonus tied to variance reduction |
For more on standardization across properties, see our analysis of standards drift in multi-property operations.
Building the Business Case for Variance Reduction
Calculating Your Variance Opportunity
Use this framework to quantify the financial opportunity from variance reduction at your specific portfolio.
Variance Reduction Calculator:
| Input | Your Portfolio | Example |
|---|---|---|
| Number of properties | _____ | 25 |
| Average rooms per property | _____ | 140 |
| Average annual occupancy | _____ | 71% |
| Total occupied room nights | _____ | 25 × 140 × 0.71 × 365 = 907,325 |
| Current portfolio average HPOR | _____ | 1.48 |
| Target HPOR (top quartile) | _____ | 1.32 |
| HPOR reduction opportunity | _____ | 0.16 hours |
| Hours saved annually | _____ | 907,325 × 0.16 = 145,172 hours |
| Fully loaded hourly cost | _____ | $19.50 |
| Annual savings opportunity | _____ | 145,172 × $19.50 = $2,830,854 |
Pro Tip from the Floor: “I presented this calculator to ownership with our actual numbers. Within six months, they approved a $150,000 investment in labor management technology. The payback was under 11 weeks.” — CFO, regional hotel group
ROI Timeline for Variance Initiatives
Variance reduction requires investment before generating returns. Set realistic expectations.
| Phase | Timeline | Investment | Expected Return |
|---|---|---|---|
| Assessment and baseline | Months 1–2 | Staff time, data analysis | None (discovery phase) |
| Technology implementation | Months 2–4 | Software, training, integration | Minimal |
| Process standardization | Months 4–6 | Travel, training, SOP development | 10–20% of opportunity |
| Full adoption | Months 6–12 | Ongoing management attention | 40–60% of opportunity |
| Optimization | Year 2+ | Continuous improvement | 70–85% of opportunity |
For context on ROI calculations, see our guide on hotel software ROI calculations.
Implementation Roadmap
Phase 1: Baseline Assessment (Weeks 1–4)
Objectives:
- Collect labor data from all properties
- Normalize data for comparison
- Calculate current variance levels
- Identify top and bottom performers
Deliverables:
- Portfolio labor variance report
- Property ranking by efficiency
- Initial outlier identification
Phase 2: Outlier Investigation (Weeks 5–8)
Objectives:
- Investigate high-variance properties
- Identify root causes
- Document current practices at top performers
- Develop preliminary recommendations
Deliverables:
- Root cause analysis for each outlier
- Best practice documentation
- Preliminary improvement plans
Phase 3: Standardization (Weeks 9–16)
Objectives:
- Develop portfolio staffing standards
- Create scheduling templates
- Train property leadership
- Implement monitoring dashboards
Deliverables:
- Staffing standards manual
- Scheduling templates by hotel type
- Dashboard rollout to all properties
Phase 4: Optimization (Ongoing)
Objectives:
- Monitor variance metrics continuously
- Intervene when thresholds are exceeded
- Refine standards based on results
- Share evolving best practices
Deliverables:
- Monthly variance reports
- Quarterly trend analysis
- Annual standards revision
Common Pitfalls and How to Avoid Them
Pitfall 1: Comparing Incomparable Properties
The Mistake: Comparing a resort with 4.5 HPOR to a select-service property with 1.4 HPOR and declaring the select-service property “more efficient.”
The Fix: Always segment by hotel type before comparing. Create peer groups of comparable properties.
Pitfall 2: Ignoring Quality in Efficiency Analysis
The Mistake: Celebrating a property’s low HPOR without checking whether guest satisfaction, audit scores, or brand standard compliance has declined.
The Fix: Always cross-reference labor efficiency with quality metrics. The goal is optimal efficiency, not minimal staffing.
Pitfall 3: Using Outdated Benchmarks
The Mistake: Comparing current HPOR to pre-pandemic or outdated industry standards that no longer reflect current operating models.
The Fix: Use current-year industry data and update benchmarks annually. What was efficient in 2019 may be understaffed in 2026.
Pro Tip from the Floor: “We were patting ourselves on the back for hitting our 2019 HPOR targets until we realized the industry had moved. Our ‘efficient’ properties were actually overstaffed by current standards.” — Operations analyst, major hotel brand
Pitfall 4: Mandating Without Supporting
The Mistake: Sending properties variance targets without providing the tools, training, or technology to achieve them.
The Fix: Pair every mandate with resources. If you require lower HPOR, provide scheduling optimization tools, cross-training programs, and efficiency audits.
Measuring Success
Key Performance Indicators for Variance Reduction
| KPI | Baseline Measurement | Target | Measurement Frequency |
|---|---|---|---|
| Portfolio HPOR variance | Standard deviation of property HPOR | Reduce by 30% in Year 1 | Monthly |
| Outlier count | Properties with >15% variance | Reduce to 10% of portfolio | Monthly |
| Labor cost per occupied room | Current portfolio average | Reduce by 8% in Year 1 | Monthly |
| Quality-adjusted efficiency | HPOR relative to audit scores | Improve by 15% | Quarterly |
| Best practice adoption | Properties using standard templates | 100% compliance | Quarterly |
Long-Term Sustainability
Variance reduction is not a one-time project. Build systems that maintain gains.
Sustainability Mechanisms:
| Mechanism | Purpose | Owner |
|---|---|---|
| Automated variance alerts | Catch regression early | Operations technology |
| Quarterly variance reviews | Maintain leadership focus | Regional directors |
| Annual staffing standard updates | Keep benchmarks current | Corporate operations |
| Variance-linked incentives | Align GM motivation | Human resources |
Conclusion: From Variance to Value
Labor variance across your portfolio represents one of the largest controllable expense categories in hotel operations. The difference between top-performing and underperforming properties often exceeds 30 percent—a gap that compounds across hundreds of thousands of occupied room nights into millions of dollars.
The operators who win in 2026 and beyond will be those who treat labor variance with the same analytical rigor they apply to revenue management. They will normalize data properly, identify outliers systematically, and implement standardization that protects both margins and service quality.
The data exists in your portfolio right now. The only question is whether you will use it.
Ready to Reduce Labor Variance Across Your Portfolio?
HAS provides centralized audit and operational data across all your properties, enabling the variance analysis, outlier identification, and standardization that drives portfolio-wide efficiency.
Schedule a Demo to see how multi-property operators use HAS to identify and eliminate labor variance—turning scattered data into actionable insight.
Related Resources

About the Author
Orvia Team
Hotel Audit Experts
The Orvia team brings decades of combined experience in hospitality operations, quality assurance, and technology. We're passionate about helping hotels maintain exceptional standards.