
The Multi-Property Comparison Challenge
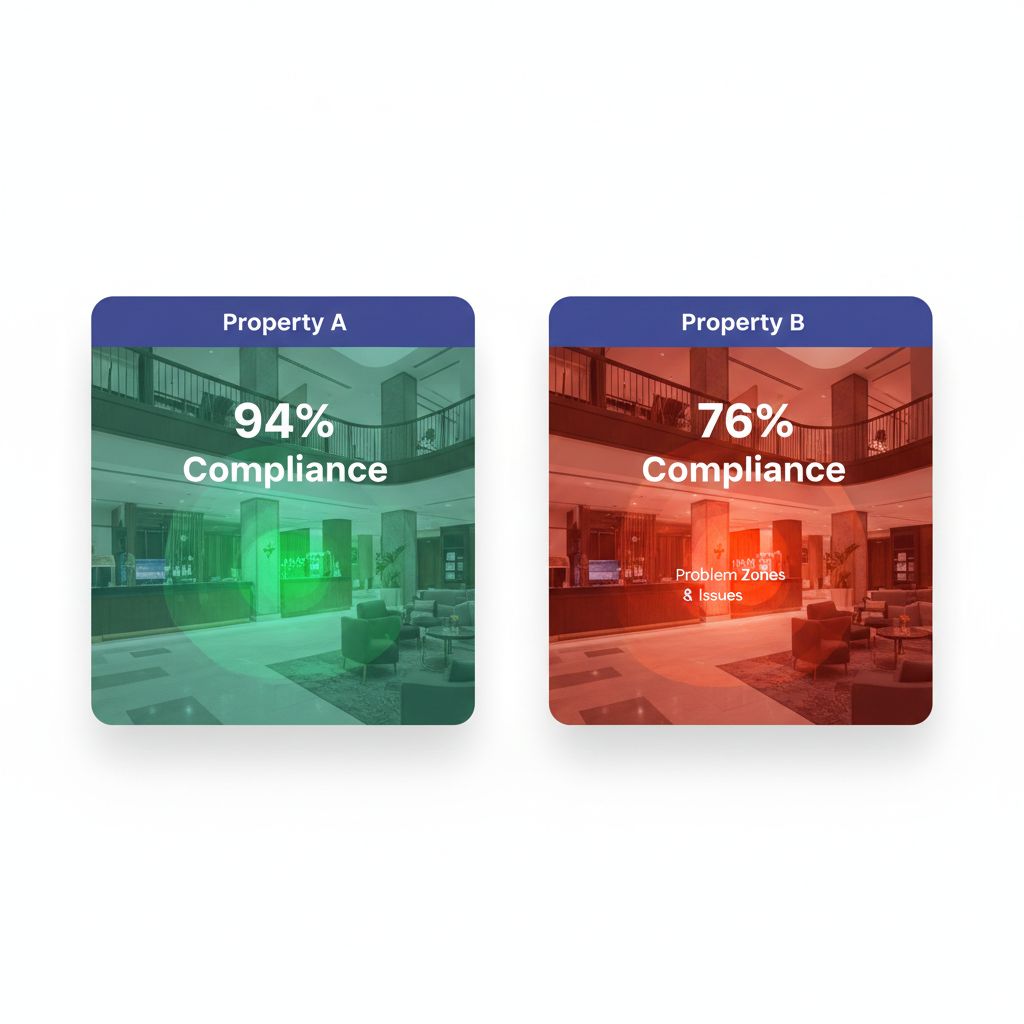
“Our Miami property scored 82%. Our Denver property scored 78%. Miami wins.”
That conclusion seems logical, until you discover that Miami has 120 rooms while Denver has 340 rooms, Miami renovated last year while Denver is in year 15 of its lifecycle, and Miami serves leisure travelers while Denver hosts demanding corporate guests.
Suddenly, that 4-point difference might indicate Denver is actually outperforming.
Multi-property operators face a fundamental challenge: how do you compare properties that differ in size, age, location, market position, and operational complexity? Raw scores and simple rankings create misleading pictures that can misdirect investment, unfairly penalize excellent GMs (General Managers), and mask genuine performance problems.
This guide explores the science and practice of creating true apples-to-apples comparisons across hotel portfolios.
Why Raw Comparisons Fail
The Size Illusion
Consider two properties in the same region:
Property A (120 rooms)
- Total audit findings: 24
- Housekeeping staff: 15
- Maintenance requests per month: 180
Property B (380 rooms)
- Total audit findings: 65
- Housekeeping staff: 42
- Maintenance requests per month: 520
Which property performs better? Raw numbers suggest Property A, but per-room calculations tell a different story:
Normalized View:
| Metric | Property A | Property B |
|---|---|---|
| Findings per room | 0.20 | 0.17 |
| Staff ratio | 1:8 | 1:9 |
| Maintenance per room | 1.50 | 1.37 |
Property B actually outperforms on every normalized metric—a conclusion invisible in raw data.
The Context Blind Spot
Numbers without context mislead:
- Seasonal properties naturally show different patterns than year-round operations
- Recently renovated properties score higher on appearance but may have staff learning new systems
- Convention hotels experience quality fluctuations tied to event calendars
- Airport properties have different guest expectations than resort destinations
A benchmarking system that ignores these factors creates rankings that punish properties for circumstances rather than performance.
The Comp Set Problem
The hospitality industry uses competitive sets (comp sets) for revenue benchmarking—comparing your property against 5-8 similar hotels in your market. Common metrics include:
- ARI (Average Rate Index): Your ADR divided by comp set ADR
- MPI (Market Penetration Index): Your occupancy divided by comp set occupancy
- RGI (Revenue Generation Index): Your RevPAR divided by comp set RevPAR
These work for revenue because external market data exists. But for operational quality—audit scores, guest satisfaction, maintenance efficiency—no external comp set data exists. You must create internal benchmarks.
Building Normalization Frameworks
Per-Unit Normalization
The simplest approach: calculate metrics per room, per square foot, or per employee.
Common Normalizations:
| Raw Metric | Normalized Version |
|---|---|
| Total audit findings | Findings per 100 rooms |
| Maintenance costs | Cost per occupied room |
| Staff complaints | Complaints per 100 employees |
| Energy consumption | kWh per square foot |
| Cleaning time | Minutes per room type |
Pro Tip from the Floor: “We stopped comparing total maintenance costs and started comparing cost per occupied room-night. Suddenly our ‘expensive’ ski resort looked efficient—they have 40% seasonality that was skewing raw totals.” — VP Operations, Western mountain portfolio
Complexity-Adjusted Metrics
Not all rooms require equal effort. A 500-square-foot studio differs from a 1,200-square-foot suite.
Room Complexity Weighting:
| Room Type | Complexity Factor |
|---|---|
| Standard room | 1.0 |
| King/Queen upgrade | 1.1 |
| Junior suite | 1.3 |
| One-bedroom suite | 1.5 |
| Presidential suite | 2.5 |
| ADA accessible room | 1.2 |
A property with 60% suites faces different operational challenges than one with 95% standard rooms. Complexity-adjusted calculations acknowledge this reality.
Market Segment Adjustment
Guest expectations vary by segment:
| Segment | Quality Expectation Multiplier |
|---|---|
| Economy | 0.85 |
| Midscale | 0.95 |
| Upper Midscale | 1.0 (baseline) |
| Upscale | 1.1 |
| Upper Upscale | 1.2 |
| Luxury | 1.4 |
A luxury property scoring 85% against luxury standards may actually represent stronger performance than an economy property scoring 90% against economy standards.
Creating Meaningful Peer Groups
Internal Competitive Sets
Within your portfolio, group properties by shared characteristics:
Grouping Criteria:
- Size bands: 1-100 rooms, 101-250 rooms, 251-400 rooms, 400+ rooms
- Market segment: Economy, midscale, upscale, luxury
- Property type: Full-service, select-service, extended-stay, resort
- Location type: Urban, suburban, airport, highway, resort destination
- Age/condition: Recently renovated (0-3 years), maintained (4-10 years), due for refresh (10+ years)
- Ownership model: Managed, franchised, owned
Example Peer Groups:
| Peer Group Name | Criteria |
|---|---|
| Urban Select-Service | Urban location, 100-200 rooms, select-service brand |
| Resort Full-Service | Resort destination, full-service, 200+ rooms |
| Highway Limited-Service | Highway location, limited-service, under 100 rooms |
| Convention Hotels | Downtown, 400+ rooms, significant meeting space |
Compare properties only within their peer groups. Rankings should show “Best performing among urban select-service properties” rather than comparing resort hotels against highway motels.
Dynamic Grouping
Some factors change over time:
- Renovation cycle: Properties move between “newly renovated” and “due for refresh”
- Brand transitions: Re-branded properties need adjustment periods
- Market shifts: A suburban property may become urban as a city expands
Update peer groups annually or after significant property changes.
Contextual Benchmarking
Capturing Context Automatically
Every comparison should include relevant context:
Automatic Context Flags:
| Condition | Context Flag |
|---|---|
| Active renovation | ”Property in Phase 2 of $4M renovation” |
| Staff turnover spike | ”GM transition in progress (Month 2 of 6)“ |
| Seasonal closure | ”Returning from 4-month seasonal closure” |
| Weather event | ”Post-hurricane recovery period” |
| Market disruption | ”Convention center closed for renovation” |
| Brand standards change | ”New brand standards implemented this quarter” |
Pro Tip from the Floor: “We added a ‘context notes’ field to every audit. Now when regional reviews the dashboard and sees a dip at a property, the explanation is right there. No more accusatory phone calls based on numbers without context.” — Quality Director, Southeast portfolio
Trend Over Snapshot
Single-point comparisons mislead. A property scoring 78% might be:
- Declining from 85% (concerning)
- Improving from 72% (encouraging)
- Stable at 78% for six quarters (acceptable if above threshold)
Always present trend data alongside current scores:
Trend Categories:
- 🔼 Improving: 5+ point increase over 3 quarters
- ➡️ Stable: Within 3 points over 3 quarters
- 🔽 Declining: 5+ point decrease over 3 quarters
- ⚠️ Volatile: Swings of 10+ points between quarters
Performance vs. Potential Analysis
Raw performance scores miss an important dimension: How close is each property to its realistic potential?
Performance vs. Potential Matrix:
| High Potential | Low Potential | |
|---|---|---|
| High Performance | Stars (maintain investment) | Maximizers (maintain efficiency) |
| Low Performance | Opportunity (increase investment) | Review (strategic decision) |
A 15-year-old highway property scoring 75% might be performing at 95% of its potential. A newly renovated luxury property scoring 85% might be performing at only 70% of potential. The older property deserves recognition; the newer one needs attention.
Key Performance Indicators for Portfolio Comparison
Tier 1: Universal Metrics
Track these across all properties regardless of type:
| Metric | Formula | Benchmark Target |
|---|---|---|
| Audit Compliance Rate | Items passed / Items audited × 100 | Varies by segment |
| Repeat Finding Rate | Findings repeated from prior audit / Total findings | Under 15% |
| Closure Rate | Findings closed on time / Total findings | Over 85% |
| Critical Finding Count | Per 100 rooms, per quarter | Zero tolerance |
| Guest Complaint Index | Complaints per 1,000 room-nights | Segment-dependent |
Tier 2: Operational Efficiency Metrics
Normalized for meaningful comparison:
| Metric | Normalization | Industry Range |
|---|---|---|
| Housekeeping productivity | Rooms cleaned per labor hour | 1.5-3.0 depending on service level |
| Maintenance response time | Hours to first response | Under 2 hours for urgent |
| Energy efficiency | kWh per square foot per month | 15-35 depending on climate/type |
| Labor cost ratio | Labor $ per occupied room | Segment-dependent |
| Turnover rate | Annual % by department | Under 50% for most roles |
Tier 3: Quality Outcome Metrics
Lagging indicators that show program effectiveness:
| Metric | Data Source | Target Direction |
|---|---|---|
| Guest satisfaction score | Survey platform | Improving or stable |
| TripAdvisor/Google rating | Review platforms | Above comp set average |
| Safety incident rate | HR/Risk system | Zero serious incidents |
| Health inspection results | Regulatory records | All properties passing |
| Brand audit scores | Brand QA system | Above minimum, improving |
Building the Comparison Dashboard
Executive View
Regional and C-suite executives need high-level patterns:
Portfolio Summary Dashboard Elements:
- Overall portfolio score with trend arrow
- Top 5 and Bottom 5 performers (within peer groups)
- Red flag properties requiring attention
- Improvement leaders showing biggest positive movement
- Critical findings across portfolio (zero is the only acceptable number)
Regional View
Regional managers need actionable detail:
Regional Dashboard Elements:
- Properties ranked within their peer groups
- Trend charts showing 6-quarter history
- Finding categories by property (where are issues concentrating?)
- Closure performance by property and category
- Resource allocation indicators (understaffed properties)
Property View
General Managers need specific, actionable data:
Property Dashboard Elements:
- Score breakdown by section and category
- Comparison to peer group (where do you stand?)
- Historical trend with context annotations
- Open findings with aging
- Improvement opportunities prioritized by impact
Common Benchmarking Mistakes
Mistake #1: Ranking Without Peer Groups
Comparing a 400-room convention hotel against a 75-room boutique on raw scores produces meaningless rankings. Properties should only compete within appropriate peer groups.
Mistake #2: Point-in-Time Snapshots
A single audit score captures one moment. Quarterly trends over 2+ years reveal actual performance patterns. Avoid reacting to single data points.
Mistake #3: Ignoring Denominator Differences
If Property A had 100 items audited and Property B had 150 items audited, their raw “findings” counts are not comparable. Always calculate percentages or rates.
Mistake #4: Equal Weighting Across Segments
A cleanliness issue in a luxury hotel is more damaging than in an economy property. Benchmarking should acknowledge that the same finding has different severity across segments.
Mistake #5: Public Rankings That Shame
Publicly ranking GMs by score creates competition but also creates gaming, hiding of issues, and toxic culture. Share insights, not humiliating rankings.
Pro Tip from the Floor: “We stopped publishing GM rankings and started publishing ‘improvement stories.’ Who improved the most and how? Suddenly GMs were calling each other to share best practices instead of hiding their playbooks.” — COO, Northeast management company
Implementing Fair Benchmarking
Phase 1: Define Your Framework (Week 1-2)
- Document all properties with key characteristics (size, segment, age, type)
- Create peer groups based on meaningful similarity
- Select normalization approach for each metric type
- Define context capture requirements
Phase 2: Build Historical Baseline (Week 3-4)
- Import historical data into normalized format
- Calculate peer group averages as benchmarks
- Identify outliers requiring investigation
- Document known context for historical periods
Phase 3: Design Reporting (Week 5-6)
- Create executive dashboard with portfolio view
- Build regional reports with appropriate detail
- Design property reports with actionable insights
- Establish report distribution and review cadence
Phase 4: Launch and Calibrate (Week 7-8)
- Review initial results with regional leaders
- Identify calibration issues (peer groups that don’t make sense)
- Adjust thresholds based on actual performance distribution
- Train users on interpretation and action
Turning Benchmarks Into Improvement
Positive Deviance Analysis
When properties in the same peer group show different results, investigate the top performers:
Questions for High Performers:
- What processes are they using that others are not?
- What staffing models or training approaches are unique?
- What local best practices could transfer?
- What manager behaviors correlate with success?
Share these insights across the portfolio—benchmarking should drive learning, not just rankings.
Resource Allocation by Benchmark
Use benchmark data to inform investment decisions:
| Performance | Trend | Investment Decision |
|---|---|---|
| Above benchmark | Stable | Maintain current investment |
| Above benchmark | Declining | Investigate cause, prevent further slide |
| Below benchmark | Improving | Continue improvement investment |
| Below benchmark | Declining | Major intervention or strategic review |
Setting Property-Specific Targets
Generic “everyone scores 90%” targets ignore reality. Set targets based on:
- Current performance (realistic starting point)
- Peer group average (what similar properties achieve)
- Top quartile in peer group (stretch goal)
- Property-specific constraints (age, market, resources)
A 15-year-old highway property targeting “top quartile among highway properties” is more meaningful than targeting the same score as a newly renovated luxury property.
Conclusion: Comparison as a Learning Tool
Hotel property benchmarking should illuminate, not obscure. When done correctly, it answers crucial questions:
- Which properties need attention and resources?
- Which properties demonstrate best practices worth replicating?
- Are we improving as a portfolio over time?
- Where should we invest next?
The goal is not to create winners and losers, but to create learning—understanding why properties perform differently and what can be transferred.
With normalized metrics, appropriate peer groups, contextual understanding, and trend analysis, portfolio operators can achieve true apples-to-apples comparisons that drive meaningful improvement across every property.
Ready to build fair, actionable benchmarking across your portfolio? See how HAS enables multi-property comparison with normalized metrics and peer group analysis →
Related Resources

About the Author
Orvia Team
Hotel Audit Experts
The Orvia team brings decades of combined experience in hospitality operations, quality assurance, and technology. We're passionate about helping hotels maintain exceptional standards.